


The holiday season is in full swing, and for U.S. retailers, it is often the busiest season of the year for consumer spending. Holiday spending in the U.S. is estimated to total nearly $1 trillion in 2023 as shoppers rush to buy gifts, food, and decorations and take advantage of retailers’ steep discounts.
However, the overall strength of consumer spending obscures how trends in retail have shifted over time, often creating challenges for local stores. The pandemic played a part in accelerating a major trend that has impacted the sector in recent years: the growing shift toward e-commerce, and the decline of brick-and-mortar retail.
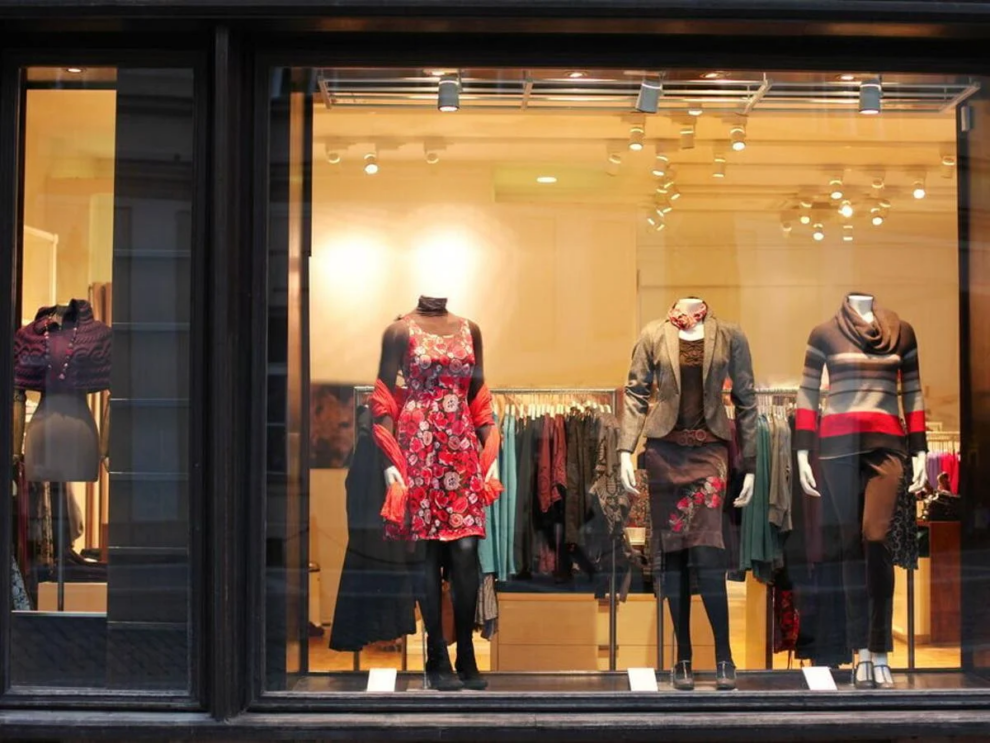
Changes in the U.S. Retail Landscape
The rise of e-commerce has strained brick-and-mortar retail. Image Credit: Upgraded Points
The retail industry has been dramatically reshaped by online sales since the turn of the millennium. In the late 1990s and early 2000s, startups like Amazon and eBay led the charge into e-commerce, and their successes led established retail chains to make online shopping a core component of their businesses. From 2000 to 2019, e-commerce grew from 0.9% of all retail sales to 10.6%. And with many physical retail stores closing or experiencing lower traffic in the wake of COVID-19, online sales jumped again to 14.6% in 2020 and have not fallen off since.
While there are some signs that independent retail is remaining resilient—catering to conscientious shoppers who prioritize buying local—the economies of scale, supply chain networks, and technological expertise available to the biggest retail players have generally been too much for competing independent stores or midsize chains to overcome. Between 2011 and 2021 (the latest 10-year period with available data from the Census Bureau), the U.S. lost 60,000 retail stores, marking a 12.6% decline in the number of stores per capita.
Regional Declines in Brick-and-Mortar Retail
In addition to Vermont, states in the Mountain West & Midwest have experienced the largest declines in brick-and-mortar retail. Image Credit: Upgraded Points
This decline has been felt differently across the country. Most of the states with steep declines in the number of brick-and-mortar retail stores per capita are found in the Mountain West and upper Midwest regions of the U.S. In contrast, the southern U.S. had the slowest rate of decline, led by Mississippi with just a 4.4% decrease.
Among major metropolitan areas with more than one million residents, Silicon Valley’s San Jose (-23.6%) and San Francisco (-19.8%) have the largest and third largest declines, respectively. Meanwhile, Seattle—home of e-commerce juggernaut, Amazon—experienced a 22.8% reduction in retail stores per capita.
Conversely, the South has generally seen the smallest reduction in brick-and-mortar retail stores. Memphis only had a 4.1% decrease in physical retail store establishments—the smallest percentage change among the nation’s largest metropolitan areas. Other major metro areas in the South like Oklahoma City (-7.5%), Tulsa (-7.5%), and Atlanta (-8.9%) also exhibited relatively minor declines in the brick-and-mortar retail space.
To determine the locations that have experienced the largest decline in brick-and-mortar retail, researchers at Upgraded Points calculated the percentage change in the number of retail store establishments per capita over the 10-year period between 2011 and 2021.
Here is a summary of the data for Mississippi:
- Percentage change in retail stores (per capita): -4.4%
- Retail stores per 1k population (2021): 3.6
- Retail stores per 1k population (2011): 3.8
- Percentage change in retail stores (overall): -4.1%
- Total change in retail stores (overall): -455
- Total retail stores (2021): 10,709
- Total retail stores (2011): 11,164
For reference, here are the statistics for the entire United States:
- Percentage change in retail stores (per capita): -12.6%
- Retail stores per 1k population (2021): 2.9
- Retail stores per 1k population (2011): 3.3
- Percentage change in retail stores (overall): -6.0%
- Total change in retail stores (overall): -60,082
- Total retail stores (2021): 946,569
- Total retail stores (2011): 1,006,651
Source: Leader Call